|
JMM 8, Winter 2009, section 4 4.1. Introduction Although mathematics and music have been linked since the time of the ancient Greeks (Benson 2006), the link between music and statistics has been relatively recent, thanks to the progress in computer technology and the avaibility of digitized scores (musical notation). Unlike Western classical music where the scores are fixed, Indian classical music is quite extempore. This means we can only analyze such a performance provided it is recorded first (so that the score can be fixed). In spite of the power which statistical methods bring to modeling, it is still quite a challenge to statistically model a performance of Indian classical music given that, despite the binding rules of the raga (fixation of notes, typical note combinations and how they are to be used in a raga etc.) the artist still has infinite freedom to express himself. The present paper gives a statistical analysis of a vocal rendition of the raga Ahir Bhairav rendered by a trained vocalist and D. Mus. from Banaras Hindu University, India.[1] Before going into the analysis, we take a look at some of the basic features of Indian Classical music in general and raga Ahir Bhairav in particular. A raga, the nucleus of Indian classical music, is a melodic structure with fixed notes and a set of rules characterizing a certain mood endorsed through performance (Chakraborty et al. 2008a). Here, the melodic structure refers to sequences of notes often with micro-pitch (sruti) alterations and articulated with an expressive sense of timing. Longer phrases are built by joining these melodic atoms together leading to a tonal hierarchy (Chordia & Rae 2007). For more on tonal hierarchy in North Indian music, we refer the reader to Castellano et al. (1984). The notes in the raga are called swars. The seven swars Sa, Re, Ga, Ma, Pa, Dha and Ni in Indian music correspond to Do, Re, Mi, Fa, Sol, La and Si respectively in Western music. The stay notes permissible in a raga are called nyas swars. The terms Vadi, Samvadi, Anuvadi, Alpvadi and Vivadi swars refer to, respectively, the most important, the second most important, the important but not vadi or samvadi, the unimportant or weak, and the non-permissible notes respectively. Ragas can be grouped according to thaats depending on the manner in which permissible notes are fixed. This is similar to the notion of mode in Western music. There are ten thaats in North Indian classical music and many more in the South. The ten thaats are Bilawal, Kafi, Khamaj, Purvi, Bhairav, Kalyan, Todi, Marwa, Bahairavi and Asavari. For Example, {Sa, Sudh Re, Komal Ga, Sudh Ma, Pa, Sudh Dha and Komal Ni} represents the Kafi thaat and accordingly, ragas Bageshree and Bhimpalashree both belong to this thaat as they use these notes. Not all ragas can be easily placed in a thaat, however. E.g. our own example, Ahir Bhairav itself creates a confusion! Ragas are also classified according to jati depending on the number of notes allowed in ascent (arohan) and descent (awarohan). The terms Aurabh, Sarabh and Sampoorna refers to five, six and seven notes being used respectively. For example, Ahir Bhairav in our case is a Sampoorna-Sampoorna raga as it allows seven notes in ascent and seven in descent (detailed later). The pakad (catch) is a defining phrase or a characteristic pattern for a raga describing its movement. For example, {Pa Ma Ga Ma Ga} is a tell-tale sign of raga Bihag.[2] In Western music, a piece of music is in a certain key, i.e., it uses the notes of a particular major or minor scale. The harmonies and counterpoint[3] developed using those notes are crucial. In contrast, Indian classical music does not emphasize harmony and does not feature counterpoint. The interest and complexities lie in melodies and rhythms. A typical Indian classical music performance features a single melody instrument or voice (in case of voice, it is shadowed by one or more accompanying melody instrument like a harmonium, a sarangi or a violin) accompanied by percussion such as a tabla and a drone (generally Sa-Pa or Sa-Ma, in exceptional cases Sa-Ga or Sa-Dha) providing a harmonical base (well, this is perhaps the only place we have a harmony!) rendered by tanpura. The artist generally “stars” with an alaap in which the raga is elaborated without percussion and then plays a song-like composition called “gat” where the percussion begins. The drone is present throughout the performance. (For more on Indian Classical music, see Menon (2007) and Priyamvada (2007). Readers familiar with Western music but new to Indian music will benefit from Jones (2009)). 4.2. Analysis of the Raga Ahir Bhairav Raga: Ahir Bhairav [
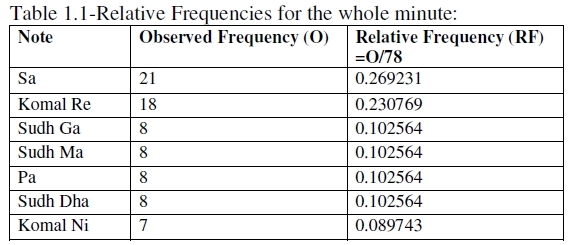
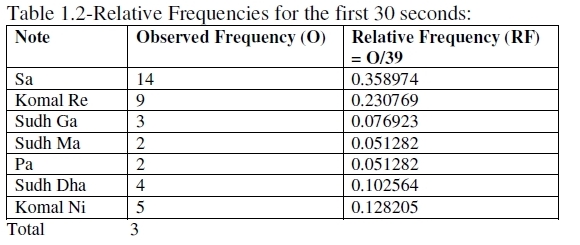
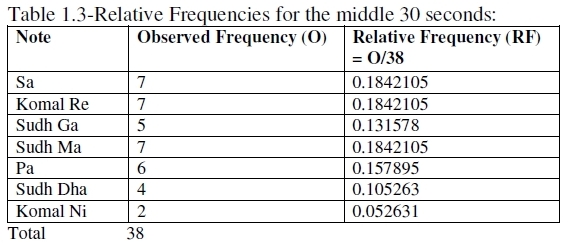
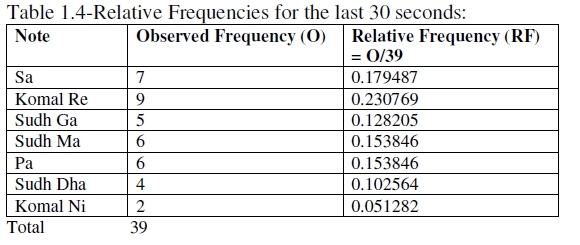
Abbreviations: The present analysis is based on a vocal performance (Sa set to natural C) and recorded by a laptop at 44.100 KHz, 16 bit mono, 86 kb/sec mode. Solo Explorer 1.0 software, a wave-to-midi converter and an automatic music trascriber for solo performances (hence the name), was used to generate the onsets and the fundamental frequencies of the notes. The software generates the notes in Western notation, but we generated the same in Indian notation, crosschecking with MATLAB; the technical details may be found in (Chakraborty et al. 2008a). 4.2.1. Statistical Analysis What is the importance of modeling from a musical perspective? It is only through modeling that we can answer questions such as “what is the probability for the next note to be a vadi or a samvadi swar?” By a vadi swar is meant that note which plays the most significant role in expressing the raga. A samvadi swar similarly is the second most significant note. When we say that a vadi swar is so called as it plays the most significant role in expressing the raga, what it tells us, apart from elaborating the mood characterizing the raga, is whether the raga is purvanga pradhan (first half more important) or uttaranga pradhan (second half more important), depending on whether the note in question is one of the notes from Sa to Pa or from Ma to Sa. As Ma and Pa fall in both the halves thus created, expert guidance is needed to decide the more important half in case the vadi swar turns out to be one of these two notes. Also the vadi swar gives us a rough idea of the ideal timing of the raga’s rendition. For a purvanga pradhan raga, such as Pilu, the timing broadly is 12 a.m.. to 12 p.m. For an uttaranga pradhan raga, such as Bhairav, the time period is somewhere between 12 p.m. and 12 a.m. (Chakraborty et al. 2008a). In the book Music and Probability (Temperley 2007), David Temperley has investigated music perception and cognition from a probabilistic point of view by means of extensive usage of Bayesian techniques. When an artist is rendering a raga, it is not possible to say definitely which note will come next. One can, still, assign a probability for a particular note to come. Now, let us direct our attention to a particular note say Sa (or Do), the tonic. One question of interest is: at every instance, does Sa have the same probability of occurring? The same question can be raised for every other note permissible in the raga. If this probability is fixed, our model is multinomial, otherwise quasi-multinomial (see also the appendix). Additionally, independence of notes overall is also required, but this is weaker than mutual independence and hence, as we shall see, generally fulfilled. If the performer is a novice and can use a wrong note (vivadi or varjit swar) by mistake, such a possibility, W (for wrong), should also be kept in mind to make the list of possible notes exhaustive. One then asks for W’s probability as well! This is not required here as we are analyzing an accomplished vocalist. Since a note can be vadi, samvadi, anuvadi, alpvadi or vivadi with respect to a raga, it is logical that its probability is raga-dependent. For example, Pa, being alpvadi in Bageshree, will have a small probability there, but in Kafi the same note has a high probability (one musical school holds Pa as vadi in Kafi; another school holds Komal Ga as vadi; even if Pa is not a vadi, it definitely is anuvadi). Again, Pa is vivadi for Malkauns, and hence its probability there is zero. We first make a comparative study of relative frequencies (ratio of number of occurrences of the note to the total number of detected notes in the specified time period) of individual notes as observed in the first 30 seconds, the middle 30 seconds and the last 30 seconds with the same for the whole minute performance. Tables 1.1-1.4 summarize the results. In the present performance of one minute’s duration, 78 notes were detected using the text file of fundamental frequencies generated by Solo Explorer against time and the database of the same for notes, using Chebushev’s inequality with 6-sigma limits; (see Chakraborty et al. (2008a) for more details).
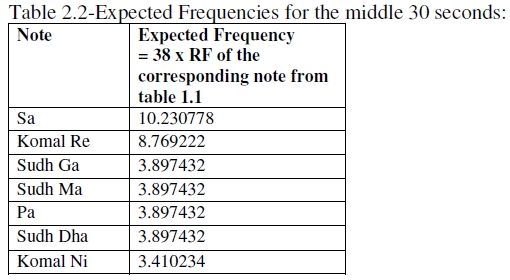
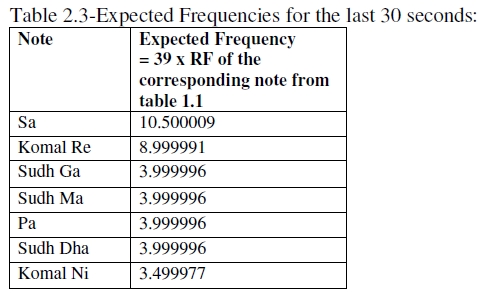
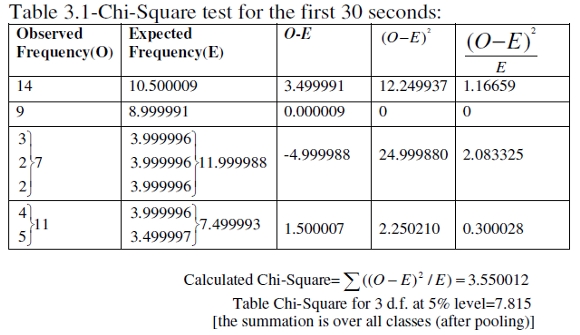
 We test for the possibility of a multinomial fit (see Gupta & Kapoor (1983) and appendix). Now, we have the formula: Expected frequency of a note in a time period = Total notes detected in the time period x Relative frequency of the note for the whole performance, because relative frequency of the note for the whole performance may be taken as a probability of arrival of the note. For example, in the first 30 sec, we had 39 notes. The probability of Sa is 0.269231 (table 1.1). Hence the expected number of Sa in the first 30 sec = 39 x 0.269231 = 10.500009. We thus prepare tables 2.1-2.3. Next we perform Chi-Square goodness of fit tests (tables 3.1-3.3). These tests are non parametric (meaning “distribution free”) (Gupta & Kappor 1983). 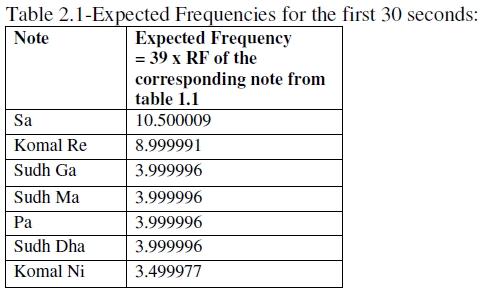
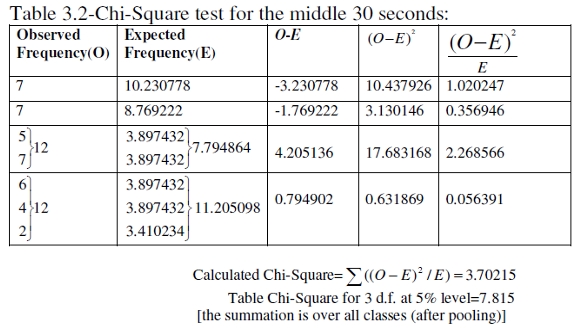
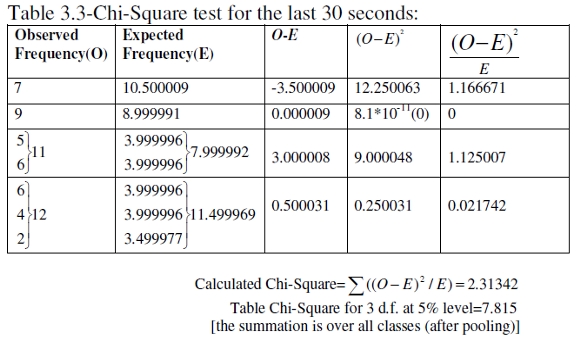 Interpretation: 4.2.2. Analysis of Transitory and Non-Transitory Pitch Movements Between the Notes According to Strawn (1985), a transition includes the ending part of the decay or release of one note, the beginning and possibly all of the attack of the next note and whatever connects the two notes. Hence, in addition to the study on modeling a performance, a count for distinct transitory and similar-looking non-transitory frequency movements (but which possibly embed distinct emotions!) between the notes was also also taken. In the characterization of ragas in Indian music, not only the notes and note sequences but also how they are rendered are important. There is a concept known as alankar in Indian music meaning ‘ornament’ (of course in a musical sense). The shastras have categorized alankars into Varnalankar and Shabdalankar (ITC Sangeet Research Academy 2009). The varnas include sthayi (stay on a note), arohi (ascent or upward movement), awarohi (descent or downward movement) and sanchari (mixture of upward and downward movement). This classification of alankars relates not only to the structural aspect of the raga, but also the raga performance. A non-transitory movement would depict staying on a note for short or long duration. In the graph it resembles a horizontal line with some tremor (the tremor is because pitch is never steady). In the present Ahir Bhairav performance, we found the following:
Among the 12 rising transitions, interestingly, four each were convex, concave and linear. But for the 12 falling transitions, as many as eight were concave, only one convex and the remaining three linear. Interpretation: Fig.1.1 gives a sample of Solo explorer graph of Ahir Bhairav. Fig 1.2 gives an inter-onset-interval graph for metrical analysis. Interpretation: Remark: We are omitting melodic study of notes. One reason is that multinomial modeling as used in the paper is a count-based modeling, as opposed to the conventional melody-based modeling practiced by other researchers such as Temperley, Eerola and Pearce to name a few, and hence can be accomplished easily without having to do melodic analysis. Another reason is that purity of the raga and melodic properties of the notes are two different things. It is possible to include some additional notes in the raga (in which case it is mishra Ahir Bhairav), make it more colourful, destroy the sudh nature or purity and yet increase the melodic properties of notes! The artist,[4] who rendered the Ahir Bhairav performance refrained from such practices. Nevertheless, studies of melodic properties of notes are useful as they tell whether notes are part of motifs (configurations) that are similar to many other motifs that occur elsewhere in the score.part. See Chakraborty et al. (2008b) where two ragas (Kafi and Sindhu) which use the same notes were statistically compared with respect to metric, melodic properties of notes and other characteristics. 4.3. Conclusion While it is true, as pointed out by one of the referees, that “. . . statistics are a means for description that does not ‘explain’ the findings at hand. In regard of the analysis of a rendition of a certain rag (Ahir Bhairav), the statistical analysis can not directly model the decision processes of the artist who performs this rag. . .”, the following facts remain: (i) one can still raise a Bayesian question like “given a note sequence, what could be the musical structure in the performer’s mind?” which is precisely one of the issues addressed by Temperley (2007), (ii) from the point of view of the analyst or the critic, there is no unique way of analyzing a performance, whence a realistic theory of a musical performance cannot be purely causal or deterministic (Beran and Mazzola 1999). In addition, (iii) musicians are themselves confused about Vadi-Samvadi selection in certain ragas such as Rageshree (see how statistics has been used to resolve this issue in Chakaraborty et al. 2008c), Bageshree, Hamir, Shankara, etc. Although this confusion did not exist in the case of Ahir Bhairav, still other questions such as “what is the probability that the next note is a Vadi swar” could be answered only through statistical modeling. The conclusion is that statistics and probability are likely to play important roles in analyzing a musical performance. 4.4. Appendix Multinomial distribution One can then calculate the correlation coefficient between xi and xj as If the probabilities vary we shall get a quasi multinomial distribution. Run Test of Randomness
To refer to this article: click in the target section |
||||||||||||||
|
|||||||||||||||